Another Look at GIS StackExchange

2013-09-13 by . 0 comments

An update to last years “Carving Up GIS StackExchange” now  “Another Look at GIS StackExchange”

Compared to last year’s results, there hasn’t been much movement in the distribution of tags. One thing I did notice, however is that the tag “qgis” leaped to the top of the list. Last year, “arcgis” was the top tag and “qgis” was number three. That said, I wouldn’t jump to too many conclusions. A quick look at the data shows that, in addition to “arcgis”, there are version-specific tags such as “arcgis-10.0” and “arcgis-10.1” as well as product-specific tags like “arcgis-server” so there’s a lot of Esri-centric discussion going on, but that is to be expected. The top ten tags, however, include major components of the OpenGeo Suite (OpenLayers, GeoServer, PostGIS) in addition to QGIS so open-source tools seem to be every bit as active a topic of discussion as do Esri tools.


GIS StackExchange top ten tags:

  1. qgis (3910)
  2. arcgis (2382)
  3. python (2171)
  4. arcgis-10.0 (2142)
  5. openlayers (1996)
  6. postgis (1560)
  7. geoserver (1193)
  8. arcobjects (1184)
  9. raster (1174)
  10. arcmap (1113)

Previous post [September 2012 ] http://blog.geomusings.com/2012/09/13/carving-up-gis-stackexchange/

New post [September 2013]

Full Credit to Bill Dollins for the Blog and Analysis. http://blog.geomusings.com/2013/09/12/another-look-at-gis-stackexchange/

Filed under GIS

Carving Up GIS StackExchange

2012-09-17 by . 8 comments

GIS SE User Bill Dollins has written an interesting blog post about GIS Stack Exchange and using the GIS SE Tags and the Stack Exchange API V2.1

In Summary a very good overview of the GIS SE site:

(pulling the information for the 100 most “popular” tags, using the StackExchange API)

Grouping of Tags “Not all fell neatly into groups so I made a few judgement calls. For example, I threw tags about the Esri Flex API into “Esri Tools” whereas “Flex” went into “Development/Programming.”

For the full blog post on this please visit http://blog.geomusings.com/2012/09/13/carving-up-gis-stackexchange/

Thanks to Bill for his time and statistical analysis of GIS SE.


Filed under GIS

Why do questions get closed?

2012-01-27 by . 0 comments

Good Question.

There are a number of reason’s why GIS Stack Exchange Moderators close questions. The most likely is because the exact same question has already been answered. Please use the the search (top right) before posting new questions.

Exact Duplicate “This question covers exactly the same ground as earlier questions on this topic; its answers may be merged with another identical question.”

A simple search on the GIS Stack Exchange site will find questions or related questions (most with answers already!) which speeds up the user having to wait for responses.

Off Topic – questions are expected to generally relate to geographic information systems, within the scope defined in the FAQ. http://gis.stackexchange.com/faq

GIS covers a large field of topics – but some can be better answered on other Stack Exchanges sites {{insert link/or list of sites}}.

What to do if you disagree?

  • post on meta, asking for clarification and the reasoning behind the closure, provide arguments for why in this particular instance should be okay

  • ask again, providing more information, better wording.

NOT Constructive

This question is not a good fit to our Q&A format. We expect answers to generally involve facts, references, or specific expertise; this question will likely solicit opinion, debate, arguments, polling, or extended discussion.

GIS SE likes Questions that can be answered – too many variables can delay or even be left unanswerable.

NOT a real Question

It’s difficult to tell what is being asked here. This question is ambiguous, vague, incomplete, overly broad, or rhetorical and cannot be reasonably answered in its current form.

GIS SE Moderators can debate this one, sometimes it just takes a polite comment/message for the question being asked to contain more content or expand on details.

Too Localized This question is unlikely to ever help any future visitors; it is only relevant to a small geographic area, a specific moment in time, or an extraordinarily narrow situation that is not generally applicable to the worldwide audience of the internet.

Can be hard for some to to be generic enough for based on the question for a very local or remote location.

Filed under GIS, Questions

Calculation and Compilation in Arcmap

2011-11-07 by . 2 comments

Who says a calculator can’t learn natural language ?

So whatever happened to VBA in the Field Calculator? Before 10.0 I grew accustomed to using VBA to leverage all sorts of geometry related interfaces. With 10.0 Esri has replaced VBA with Python and VBScript. I’m not sure why support for .NET wasn’t added, considering that both the C# and VB.NET compilers are part of the standard .NET Framework installation.

The .NET Framework provides modules that can compile source code and turn it into an assembly in memory. Maybe once ArcGIS supports .NET 4.0, I’ll adapt this proof-of-concept to use AvalonEdit. The Visual studio project files can be downloaded here.

    public CompilerResults Compile()
    {
        CodeDomProvider provider = CodeDomProvider.CreateProvider(m_Language);
        var parameters = new CompilerParameters();
        parameters.GenerateInMemory = true;
        parameters.GenerateExecutable = false;
        foreach (string reference in m_References)
        {
            parameters.ReferencedAssemblies.Add(reference);
        }
        //
        var results = provider.CompileAssemblyFromSource(parameters,m_Source);
        if (results.Errors.Count == 0)
        {
            var type = results.CompiledAssembly.GetType(TYPENAME);
            if (type == null)
                throw new Exception("type not found: " + TYPENAME);
            object o = Activator.CreateInstance(type) as IKalkulation;
            if(o == null)
                throw new Exception("unable to createinstance");
            m_kalkulation = o as IKalkulation;
            //
            if (m_kalkulation == null)
                throw new Exception("unable to cast to IKalkulation");
        }
        return results;
    }

That allows us take the dynamically generated class (that implements IKalkulation) and loop through each row in a featurelayer (or standalone table) performing the calculation using C# code entered into a form.

    while ((row = cur.NextRow()) != null)
    {
        i++;
        var obj = this.m_kalkulation.Kalkulate(row);
        row.set_Value(idx,obj);
        row.Store();
        //System.Threading.Thread.Sleep(300); use for testing cancellation
        int newPct = (int)((double)i * 100.0 / (double)total);
        if (newPct != pct)
            worker.ReportProgress(newPct);
        pct = newPct;
        if (this.CancellationPending)
            break;
    }

GIS: Where are the Languages at?

We spend a lot more time debating which general purpose language is better for GIS (C#, VB, Python, Java etc.) than we spend asking what GIS-specific languages should look like. Notice how the language choice is hidden by the compiler – it is an implementation detail. The job of the compiler is to convert human readable formal language expressions into machine language. In addition to general purpose languages like C#, VB.NET, etc., I think GIS deserves its own languages. Sure, we have the shape comparison language, but I think there is room for improvement. It should be possible to write codedom providers for things like rasters, topologies and networks.

Raster Languages

Esri once supported a product called ArcGRID which allowed several expressions (DOCELL, IF, and WHILE) that are no longer supported in Spatial Analyst. It would be possible for Esri to write a CodeDOM provider that would compile these expressions. Otherwise the same approach taken with the proof-of-concept could be adapted to work with pixels instead of IRows.

Topology Languages

Likewise, workstation ARC/INFO allowed one to easily find polylines where two polygons meet that have the same attribute – simply set up two RELATEs based on LPOLY# and RPOLY# and RESELECT the polylines based on expression where left and right attribute are not equal. In ArcMap this requires some tedious code. It seems like Esri could write a CodeDOM provider to allow topology rules to be used as search expressions and not just enforcement of business rules.

Network Languages

For geometric networks custom traceflow solvers are a very powerful tool. Imagine being able to utilize a language that made it easier to recursively build trees based on some network connectivity logic. Traversing the network using IForwardStar is just too tedious. A friendlier language is needed. Either a codeDOM provider or an IQueryable LINQ provider could support languages specifically geared towards network traversal – and would make things like ad hoc custom tracing easier.

Language is a virus. -William S. Burroughs

In other words, if your language doesn’t go viral, it won’t survive. With Stackexchange putting so many different carriers in close contact with one another, a new spatial language seems as inevitable as the next flu season.

Filed under GIS

It’s all about the data

2011-11-04 by . 2 comments
A faded ol' well used map

A faded ol' well used map

Very early in my GIS career, about 1995, my coworkers and I made a big map (3ft by 6ft at 1:250,000). It took several months and was the best we could do at the time. It was good, but, in my mind, not as good as I wished. It was printed by a 4 colour 300dpi printer, the lines were fuzzy, colours dithered, fills crosshatched, and paper speckled. The base data was comprised of several tiles, and the edge-matching was mediocre, the seams visible.

A decade and some later finds me working in an organization with deeper pockets, access to a high quality 2880x1440dpi printer with UV resistant inks (11 colours), seamless edge-matched data, and shaded relief images. A person wanders into my office and unfurled this raggedy old map. I immediately recognized it as the one we did in 1995. The corners were dog eared, full of pin holes, numerous tears adorned the edges, and wrinkled throughout. The colours had faded, the once blue rivers now a faint pink. It had been traveling from meeting to meeting, wall to wall, discussion to discussion, for 13 years and looked it.

a modern map composition

A modern map composition, not good enough.

She asked, hopefully yet resigned to a negative reply, if I could, perhaps, scan the map and print a new copy. (She had no idea I was one of the authors, her coming to our shop was just chance.) Excitedly I jumped at the chance to furnish her with a new map of the same area, made just the year before, but with much higher production value. Richer, deeper, more varied colours. Fine, crisp lines. Smooth typography, following the curve of watercourses, legible even at 6pts. No edge-matching seams. Shaded relief background smoothly blended with vegetated areas and ice fields. Finally I could fill that lack from long ago, with flourish!

She eyed the proffered replacement a time, and then politely declined. Yes it was beautiful, she said, but not as good as the old one. I was shocked. I’m sure my mouth hung open. You see, one thing we’d done all those years before, with equipment that had less computing power than today’s phones, was add place names. Lots and lots of place names, based on local knowledge. Oh. Our new maps don’t have those.

The end result? We don’t have a map-size scanner, so I carefully taped all the rips and tears on “old faithful”, double taped the edges, tripled the corners, and sent it and her back on their rounds. The old thing is probably still being used now.

A predecessor once told me, “It’s all about the data. All that other stuff is just fluff that comes and goes”. At the time he was referring to software, but this story makes it clear it applies to other technology like computers and printers as well. I didn’t really get it then, but I’m closer to understanding what he means now.

(The images are representative, they’re not the actual maps in the story. Hat tip to Bruce Mackenzie then of Ministry of Environment, Lands & Parks, BC.)

Filed under Blog, Cartography

Maperitive Tutorial: Generating OSM Map For Adobe Illustrator In Seven Easy Steps

2011-09-14 by . 7 comments

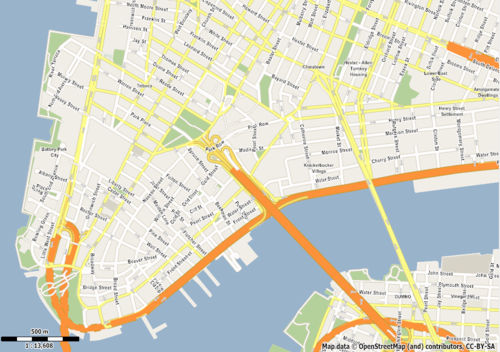
SVG map of Manhattan generated using Map

In this tutorial you will learn how to produce a vector map based on OpenStreetMap data and then export it to SVG format suitable for editing in Adobe Illustrator. SVG export is one of the most useful features Maperitive provides and I’ve spent a lot of time tweaking the code so that Illustrator can handle the exported SVGs.

NOTE: the tutorial has been written for Maperitive build 1228. Some things will change in the near future, so please visit http://maperitive.net for any updates.

First things first: start Maperitive (if you don’t already have it, you can download it from here). Unzip the package somewhere on your disk and run Maperitive.exe (on Windows) or Maperitive.sh (on Linux/Mac).

Step 1: Setting Your Map Limits

Currently Maperitive uses your computer’s memory to store map data, so there is a limit of how large a map it can work on. Because of that, we need to tell Maperitive what area we’re interested in, so all the operations will limit themselves on that area.

There are several ways to set the limits. The easiest is to move the map to the area, zoom in our out appropriately to cover all the area you want, and then use the Map / Set Bounds menu function.

I will do this manually by entering a following command in the command prompt (at the bottom of the screen):

bounds-set -74.03,40.7,-73.96,40.72

I suggest you do the same for the purposes of this tutorial, so our map areas would match. The area in question is lower end of Manhattan.

Step 2: Loading OSM Data

Now we need to get the vector OSM data for our map. There are several ways of doing this.

The easiest one is to use the Map / Download OSM Data menu function, which contacts an OSM server to fetch the data. Try it out. If it fails, try it a couple more times. The problem is that these servers are sometimes overloaded and unresponsive.

If this doesn’t work, another option is to use JOSM or the Export tab on the OSM Web Map site. In that case you will get an OSM XML file, which you need to save on your disk (using .osm extension!) and then load into Maperitive using the File / Open Map Sources menu function (or simply drag and drop the file into Maperitive).

Once the OSM data is in, we can proceed with the next step…

Step 3: Removing The Web Map

Now that we have some vector content of our own, we don’t really need the OSM web map anymore. Select the Web Map (OSM Mapnik) in the Map Sources window at the bottom of the screen and then click on the “X” button to remove it:
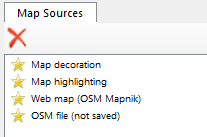
Map Sources window

Step 4: Changing The Map Style

The default map style resembles the standard OSM Web map layer (generated using Mapnik). But just to show off, we will switch to something that looks like Google Maps. Choose Map / Switch To Rules / googlemaps menu function. After a second or two of processing, the map will change its style.

Step 5: Deciding The Map Scale

Depending on your needs, you can export the map using different map scales. Map scale is directly linked to the zoom level and together they determine what type of content is visible on the map and how the content is rendered. In the case of our Google Maps-like style, the street names are starting to appear on zoom level 15 and higher, so if you need them in your export, you will have to use the zoom level 15 or higher.

The zoom level value is displayed at the bottom of the screen:

The map scale is shown at the bottom left of the map itself, together with the bar scale indicator:

For this tutorial I’ve decided the zoom level 16 is the one I want. Try it out, you can set your own later.

Step 6: Exporting To SVG

The easiest way to export would be to use Tools / Export to SVG (For Adobe Illustrator) menu function. But since we need to specify the zoom level in our case, we will type the export-svg command manually into the Command Prompt:

export-svg compatibility=illustrator zoom=16

We instructed Maperitive to export the current map to a SVG file suitable for Adobe Illustrator and to use zoom level 16. After a couple of seconds a new file called output.svg should appear under the output directory of your Maperitive installation.

Step 7: Import Into Adobe Illustrator

Now that you have a SVG file, open up your AI and import it. If it complains about “roundtrips to Tiny“, simply ignore that.

Adobe Illustrator vs. Inkscape

You may wonder why you had to specify the compatibility=illustrator argument in the Step 6. I will just quote Maperitive documentation on this:

Due to the pretty buggy support which Adobe Illustrator provides for loading SVG files, it is not possible to have the same SVG optimally shown in both Illustrator and Inkscape. In other words, if you plan to use the SVG file in Illustrator, you should specify compatibility=illustrator parameter. Maperitive will in this case do some tweaks to the SVG file which allow it to be shown without any problems in Illustrator (tested in CS5). But do not expect this file to be usable in other SVG viewers/editors. On the other hand, if you need a SVG file which can be shown in various Web browsers and editable in Inkscape, you should specify compatibility=inkscape parameter. Again, do not expect this file to be usable in Illustrator.

Advanced Stuff

This tutorial shows only the basic workflow, but there are many ways of how the workflow can be customized:

  • using precision typography: the default setting of the export-svg command relies on Illustrator’s rendering of text on paths. By specifying the precision-typo=true command argument, each letter of a street label is positioned separately, which improves the quality of the rendering, but it can also slow down Illustrator dramatically.
  • modifying the map style to suit your needs
  • adding hillshading, hypsometric tinting and relief contours based on SRTM DEM data, especially for topo maps. Maperitive provides several menu functions and commands for this.
  • automating the whole process by writing a Maperitive script.

A Quick Guide to GIS Stack Exchange Questions

2011-09-13 by . 0 comments

What kind of questions can be asked on GIS Stack Exchange? The Geographic Information Systems Stack Exchange is for is for questions concerning geographic information systems and science. We welcome cartographers, database administrators, geographers, programmers, and anyone interested in or using GIS professionally.

Please see other places for help for questions which are off topic here (such as general questions on databases, server setup, web services, programming, etc.).

Although the scope of questions appropriate here is wide, befitting the range of GIS applications please make an initial effort to research the answer before you ask a question. That will help you write a great, focused question that gets excellent answers. Questions that are too basic (meaning the answer is indexed in any number of general internet reference sources designed specifically to find that type of information)will be closed.

GIS SE aim is to create a lasting record of great solutions to questions. Providing references to peer-reviewed literature or links to on-line resources is warmly welcomed. You can also incorporate the work of others under fair use doctrine, which particularly means that you must attribute any text, images, or other material that is not originally yours.

Please look around to see if your question has been asked before. Duplicates are Flagged for Moderation It’s also Okay to ask and answer your own question.

What kind of questions should I not ask here?

You should only ask practical, answerable questions based on actual problems that you face. Chatty, open-ended questions diminish the usefulness of our site and push other questions off the front page. Open-End cannot be completed and makes it harder for people to give correct answers.

Your questions should be reasonably scoped. If you can imagine an entire book that answers your question, you’re asking too much.

If your motivation for asking the question is “I would like to participate in a discussion about”, then you should not be asking here. However, if your motivation is “I would like others to explain … to me”, then you are OK. (Discussions are welcome in our real time web chat.)

How do I ask questions here? When you post a new question, other users will almost immediately see it and try to provide good answers. This often happens in a matter of minutes, so be sure to check back frequently when your question is still new for the best response.

Answers to your questions and comment replies to your posts will appear as a red indicator in your global inbox at the top left of every page.

Reputation The primary way to gain reputation is by posting good questions and useful answers. Your peers will vote on your posts, and those votes will cause you to gain (or, in rare cases, lose) reputation:

answer is voted up +10
question is voted up +5
answer is accepted +15 (+2 to acceptor)
question is voted down -2
answer is voted down -2 (-1 to voter)


A maximum of 40 votes can be cast per user per day, however, to reach the maximum you must vote on at least 10 questions. You can earn a maximum of 200 reputation per day. Please note that votes for posts marked “community wiki” do not generate any reputation, while accepted answers and bounty awards are not subject to the daily reputation limit.

The other way to gain reputation is by suggesting edits to existing posts as a new registered user. Each edit will be peer reviewed, and if it is accepted, you will earn +2 reputation. You can only earn a maximum of +1000 total reputation through suggested edits, however.

15 Vote up
15 Flag for moderator attention
50 Leave comments
100 Edit community wiki posts
125 Vote down (costs 1 rep on answers)
200 Reduced advertising
250 Vote to close, reopen, or migrate your questions
300 Create new tags
500 Retag questions
1000 Show total up and down vote counts
2000 Edit other people’s posts, vote to approve or reject suggested edits
3000 Vote to close, reopen, or migrate any questions
5000 Vote to approve or reject suggested tag wiki edits
10000 Vote to delete closed questions, access to moderation tools
15000 Protect questions to prevent answers by new users
20000 Vote to delete negatively voted answers and stronger question deletion votes

Further Details can be found at the GIS SE FAQ


Filed under Community, GIS, Questions

GIS Blog Launched

Welcome to the New GIS Blog Overflow, a new additional to GIS Stack Exchange Community

New content will be coming soon from community members from the GIS Stack Exchange.

Popular & reoccurring topics on GIS.SE, events related to GIS and the GIS.SE community with a random collection of posts by different authors will give a good wide cross-section of articles.

  • Popular questions will be also expanded.
  • Commercial and Open Source related GIS posts (includes beta software) are welcomed.
  • Community GIS News and Events will also be included
Potential Blog Author?
If you have a post that you would like to be included please contact the moderator (Mapperz) by leaving a comment on this post.
Many thanks to the community users input who have made this blog possible

http://meta.gis.stackexchange.com/questions/591/gis-stackexchange-blog

Filed under Blog, Community, GIS