Cartography
It’s all about the data

A faded ol' well used map
Very early in my GIS career, about 1995, my coworkers and I made a big map (3ft by 6ft at 1:250,000). It took several months and was the best we could do at the time. It was good, but, in my mind, not as good as I wished. It was printed by a 4 colour 300dpi printer, the lines were fuzzy, colours dithered, fills crosshatched, and paper speckled. The base data was comprised of several tiles, and the edge-matching was mediocre, the seams visible.
A decade and some later finds me working in an organization with deeper pockets, access to a high quality 2880x1440dpi printer with UV resistant inks (11 colours), seamless edge-matched data, and shaded relief images. A person wanders into my office and unfurled this raggedy old map. I immediately recognized it as the one we did in 1995. The corners were dog eared, full of pin holes, numerous tears adorned the edges, and wrinkled throughout. The colours had faded, the once blue rivers now a faint pink. It had been traveling from meeting to meeting, wall to wall, discussion to discussion, for 13 years and looked it.
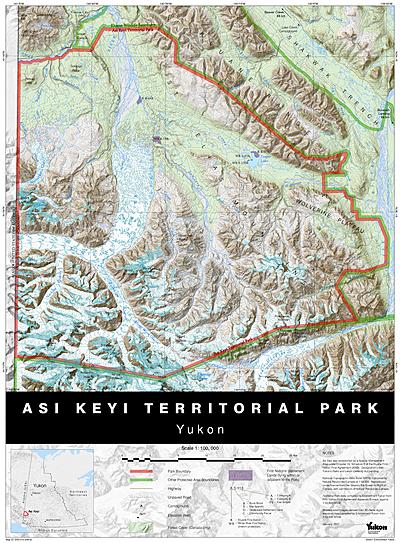
A modern map composition, not good enough.
She asked, hopefully yet resigned to a negative reply, if I could, perhaps, scan the map and print a new copy. (She had no idea I was one of the authors, her coming to our shop was just chance.) Excitedly I jumped at the chance to furnish her with a new map of the same area, made just the year before, but with much higher production value. Richer, deeper, more varied colours. Fine, crisp lines. Smooth typography, following the curve of watercourses, legible even at 6pts. No edge-matching seams. Shaded relief background smoothly blended with vegetated areas and ice fields. Finally I could fill that lack from long ago, with flourish!
She eyed the proffered replacement a time, and then politely declined. Yes it was beautiful, she said, but not as good as the old one. I was shocked. I’m sure my mouth hung open. You see, one thing we’d done all those years before, with equipment that had less computing power than today’s phones, was add place names. Lots and lots of place names, based on local knowledge. Oh. Our new maps don’t have those.
The end result? We don’t have a map-size scanner, so I carefully taped all the rips and tears on “old faithful”, double taped the edges, tripled the corners, and sent it and her back on their rounds. The old thing is probably still being used now.
A predecessor once told me, “It’s all about the data. All that other stuff is just fluff that comes and goes”. At the time he was referring to software, but this story makes it clear it applies to other technology like computers and printers as well. I didn’t really get it then, but I’m closer to understanding what he means now.
(The images are representative, they’re not the actual maps in the story. Hat tip to Bruce Mackenzie then of Ministry of Environment, Lands & Parks, BC.)
Maperitive Tutorial: Generating OSM Map For Adobe Illustrator In Seven Easy Steps
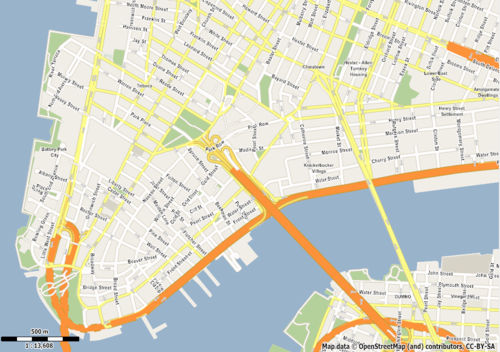
SVG map of Manhattan generated using Map
- SVG map: http://dl.dropbox.com/u/6894864/Manhattan/Manhattan.svg
- PNG map (low DPI): http://dl.dropbox.com/u/6894864/Manhattan/Manhattan_small.png
- PNG map (higher DPI): http://dl.dropbox.com/u/6894864/Manhattan/Manhattan_big.png
In this tutorial you will learn how to produce a vector map based on OpenStreetMap data and then export it to SVG format suitable for editing in Adobe Illustrator. SVG export is one of the most useful features Maperitive provides and I’ve spent a lot of time tweaking the code so that Illustrator can handle the exported SVGs.
NOTE: the tutorial has been written for Maperitive build 1228. Some things will change in the near future, so please visit http://maperitive.net for any updates.
First things first: start Maperitive (if you don’t already have it, you can download it from here). Unzip the package somewhere on your disk and run Maperitive.exe (on Windows) or Maperitive.sh (on Linux/Mac).
Step 1: Setting Your Map Limits
Currently Maperitive uses your computer’s memory to store map data, so there is a limit of how large a map it can work on. Because of that, we need to tell Maperitive what area we’re interested in, so all the operations will limit themselves on that area.
There are several ways to set the limits. The easiest is to move the map to the area, zoom in our out appropriately to cover all the area you want, and then use the Map / Set Bounds menu function.
I will do this manually by entering a following command in the command prompt (at the bottom of the screen):
bounds-set -74.03,40.7,-73.96,40.72
I suggest you do the same for the purposes of this tutorial, so our map areas would match. The area in question is lower end of Manhattan.
Step 2: Loading OSM Data
Now we need to get the vector OSM data for our map. There are several ways of doing this.
The easiest one is to use the Map / Download OSM Data menu function, which contacts an OSM server to fetch the data. Try it out. If it fails, try it a couple more times. The problem is that these servers are sometimes overloaded and unresponsive.
If this doesn’t work, another option is to use JOSM or the Export tab on the OSM Web Map site. In that case you will get an OSM XML file, which you need to save on your disk (using .osm extension!) and then load into Maperitive using the File / Open Map Sources menu function (or simply drag and drop the file into Maperitive).
Once the OSM data is in, we can proceed with the next step…
Step 3: Removing The Web Map
Now that we have some vector content of our own, we don’t really need the OSM web map anymore. Select the Web Map (OSM Mapnik) in the Map Sources window at the bottom of the screen and then click on the “X” button to remove it:
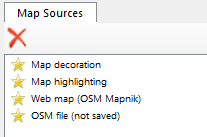
Map Sources window
Step 4: Changing The Map Style
The default map style resembles the standard OSM Web map layer (generated using Mapnik). But just to show off, we will switch to something that looks like Google Maps. Choose Map / Switch To Rules / googlemaps menu function. After a second or two of processing, the map will change its style.
Step 5: Deciding The Map Scale
Depending on your needs, you can export the map using different map scales. Map scale is directly linked to the zoom level and together they determine what type of content is visible on the map and how the content is rendered. In the case of our Google Maps-like style, the street names are starting to appear on zoom level 15 and higher, so if you need them in your export, you will have to use the zoom level 15 or higher.
The zoom level value is displayed at the bottom of the screen:
![]()
The map scale is shown at the bottom left of the map itself, together with the bar scale indicator:

For this tutorial I’ve decided the zoom level 16 is the one I want. Try it out, you can set your own later.
Step 6: Exporting To SVG
The easiest way to export would be to use Tools / Export to SVG (For Adobe Illustrator) menu function. But since we need to specify the zoom level in our case, we will type the export-svg command manually into the Command Prompt:
export-svg compatibility=illustrator zoom=16
We instructed Maperitive to export the current map to a SVG file suitable for Adobe Illustrator and to use zoom level 16. After a couple of seconds a new file called output.svg should appear under the output directory of your Maperitive installation.
Step 7: Import Into Adobe Illustrator
Now that you have a SVG file, open up your AI and import it. If it complains about “roundtrips to Tiny“, simply ignore that.
Adobe Illustrator vs. Inkscape
You may wonder why you had to specify the compatibility=illustrator argument in the Step 6. I will just quote Maperitive documentation on this:
Due to the pretty buggy support which Adobe Illustrator provides for loading SVG files, it is not possible to have the same SVG optimally shown in both Illustrator and Inkscape. In other words, if you plan to use the SVG file in Illustrator, you should specify compatibility=illustrator parameter. Maperitive will in this case do some tweaks to the SVG file which allow it to be shown without any problems in Illustrator (tested in CS5). But do not expect this file to be usable in other SVG viewers/editors. On the other hand, if you need a SVG file which can be shown in various Web browsers and editable in Inkscape, you should specify compatibility=inkscape parameter. Again, do not expect this file to be usable in Illustrator.
Advanced Stuff
This tutorial shows only the basic workflow, but there are many ways of how the workflow can be customized:
- using precision typography: the default setting of the
export-svgcommand relies on Illustrator’s rendering of text on paths. By specifying theprecision-typo=truecommand argument, each letter of a street label is positioned separately, which improves the quality of the rendering, but it can also slow down Illustrator dramatically. - modifying the map style to suit your needs
- adding hillshading, hypsometric tinting and relief contours based on SRTM DEM data, especially for topo maps. Maperitive provides several menu functions and commands for this.
- automating the whole process by writing a Maperitive script.